Home > Newsletters > 10 Things I Hate about Data
10 Things I Hate about Data
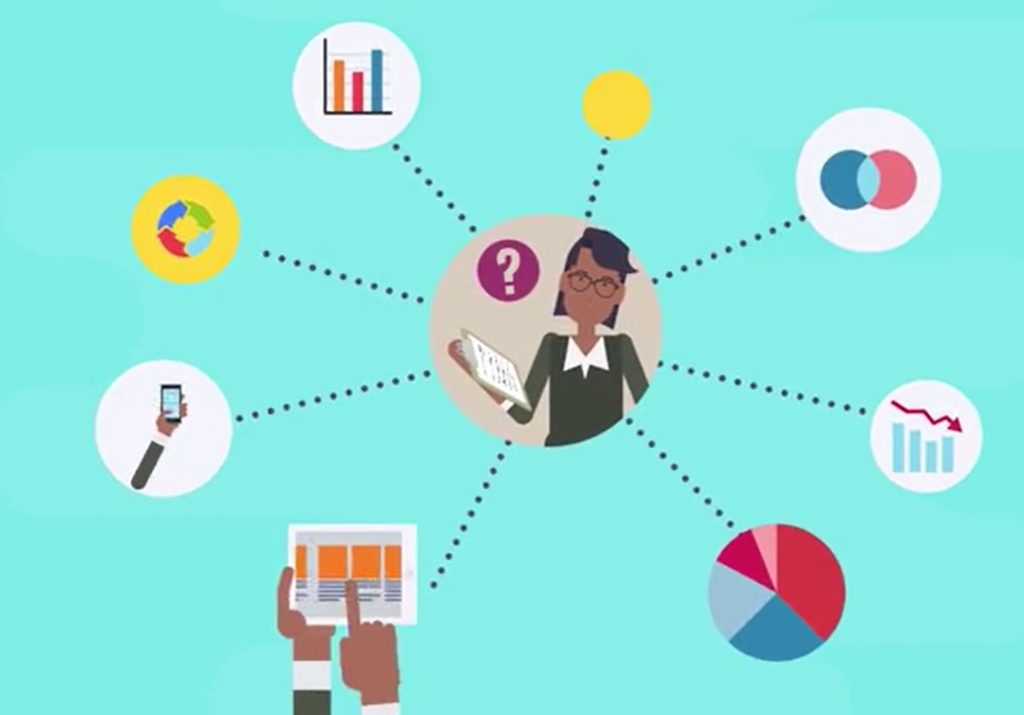
Data is necessary for good program implementation. Whether the idea of data makes you feel overwhelmed, underwhelmed, or just whelmed – we understand! The data-minded folks here at the Impact Center at FPG have put together a list of our least favorite things about data, and some resources to check out if you’d like to learn more or just switch up your data game.
10 of our least favorite things about data
- Surveys
- Data without a purpose
- Relying on quantitative data
- Overly complicated results
- Not disaggregating your data
- Pie charts
- Lack of context
- Lack of conclusion
- Reporting black holes
- Real life
1. Surveys
Sometimes it feels like we’re drowning in surveys. Though paper and online surveys are often easy ways to collect data, they are not the only way to get information.
Consider using focus groups or interviews to gather the information you need. Want to try it? Here’s some great guidance from the University of Kansas’ Community Toolbox.
2. Data without a purpose
If the data are not useful in decision-making (or required by your funder), don’t collect it. “Just in case” or “I’m curious” is not a good enough reason for the burden on your partners or your internal data staff.
Ask “what is the purpose of this question” for all data collection efforts. If you can’t name what you will do with the data in the next 12 months, consider dropping the question.
Here’s a brief article from Forbes on asking the right questions: A Simple Strategy For Asking Your Data The Right Questions. Remember you can usually adjust your data collection plan if you find your needs change!
3. Relying on quantitative data
Often, we associate data with ‘numbers,’ however, sharing qualitative or non-numeric information (think interviews, discussions, jamboards, photos, write-in survey responses) is just as important and can often help you share the stories behind the numbers.
Check out these podcast series that highlight the use of qualitative data from NVivo and the American Educational Research Association.
4. Overly complicated results
In nearly any setting, most people want the basics: “Is it going well or poorly? Is this happening frequently or rarely? What is the scope?” Even though you may want to show off all the wonderful information you’ve collected, answering the easy questions first is a good place to start.
You don’t need to be a statistician to determine if most people found a training helpful and you don’t need expertise in data visualization to show that 4 out of 5 people are in favor of a project. More accessible results also mean more accessible collection and analysis.
5. Not disaggregating your data
Not disaggregating your data when appropriate. Breaking your data down by race, ethnicity, gender, sexual orientation, ability status, zip code (urban/rural) – among other important groups – can highlight the very inequities your coalition is trying to address.
Here are some suggestions on disaggregation from the Population Reference Bureau and considerations for data aggregations from Urban Institute to help you think about what works in your context.
6. Pie charts
Pie charts can be confusing. A good pie chart should (1) have less than three “slices” (such as demographic groups or health outcomes) and (2) never be used to compare two groups (e.g., Grand County vs. Story County).
Stacked columns, slope graphs, or dot plots are better for comparing groups and for comparing more than two categories. If you want to learn more about pie charts done right, Anne Emery has a great guide.
7. Lack of context
Hearing numbers without context can make information confusing and isolating. “90% of people prefer to work in the office” takes on an entirely different meaning when you learn that this question was only asked of those who voluntarily returned as soon as regulations lifted.
Consider and include contextual information that most people would find important. Who asked this question? Who responded? What percent responded? How was data collected? Context provides a more well-rounded picture when paired with your data summary.
8. Lack of conclusion
Presenting data without a conclusion is like a fable without a moral. Sure, you know Goldilocks slept in 3 beds and only one was comfortable but what are you supposed to do with that information? What are the next steps? And why were you even listening to the story in the first place?
Offering information about what you learned or didn’t learn, and where you plan to go from here, can prevent others from asking themselves these questions. Having explicitly stated goals while planning data collection can make these easy to answer.
9. Reporting black holes
Sharing data with funders, leadership, or community coalitions is an expected requirement of many programs, but less often do we hear back about how that data is used, why it’s being collected, or an overview analysis.
Share back results with the people who have participated in your data collection or given you their organizational data; it builds trust and buy-in and may even generate new ideas on how to boost your use of data. Ask your leadership to report back on how your data was used. The American Evaluation Association has a guide to data placemats and data gallery walks, as does the Urban Institute. FSG has a great group learning guide for more ideas.
10. Real life
As much as we recommend these changes, sometimes life gets in the way. We have all ended up doing data things that we hate, including everything on this list! Managers request the data “just in case…” there aren’t enough funds or time to do a focus group… there is no race, gender, or ethnicity data to disaggregate…
Our recommendation is to give yourself grace. Understand that some of these things are outside of your control but work to do the things that you can.
Looking for support with data?
- Connect with your ICTP Implementation Support practitioner or one of our data specialists:
- Shannon Chaplo, Implementation Specialist, for qualitative data questions
- Ariel Everett, Implementation Associate, for health equity and DEI data questions
- Rebecca Roppolo, Senior Implementation Specialist, for general data questions
Contributors
The Impact Center at Frank Porter Graham Child Development Institute, UNC-CH
Shannon Chaplo, Ariel Everett and Rebecca Roppolo
For Triple P Support
For Triple P Service Delivery Agencies in North Carolina and South Carolina:
Connect with your regional Triple P Lead Implementing Agency or county Backbone Organization.
For Triple P Lead Implementing Agencies in North Carolina:
Contact your implementation support team with The Impact Center at FPG.
For Triple P Backbone Organizations in South Carolina:
Contact your community capacity coach with Children’s Trust.
Have questions about implementing your Triple P program? Please connect with us!